Yes #1 · the loud one
VIZZI.
Yes, and —
Press one button and a grid of twelve pictures starts telling you the truth about a sound you thought you already knew.
Yes #1 · the loud one
Press one button and a grid of twelve pictures starts telling you the truth about a sound you thought you already knew.
Grade ASay yes to the noise — and then notice the noise was doing arithmetic the whole time.
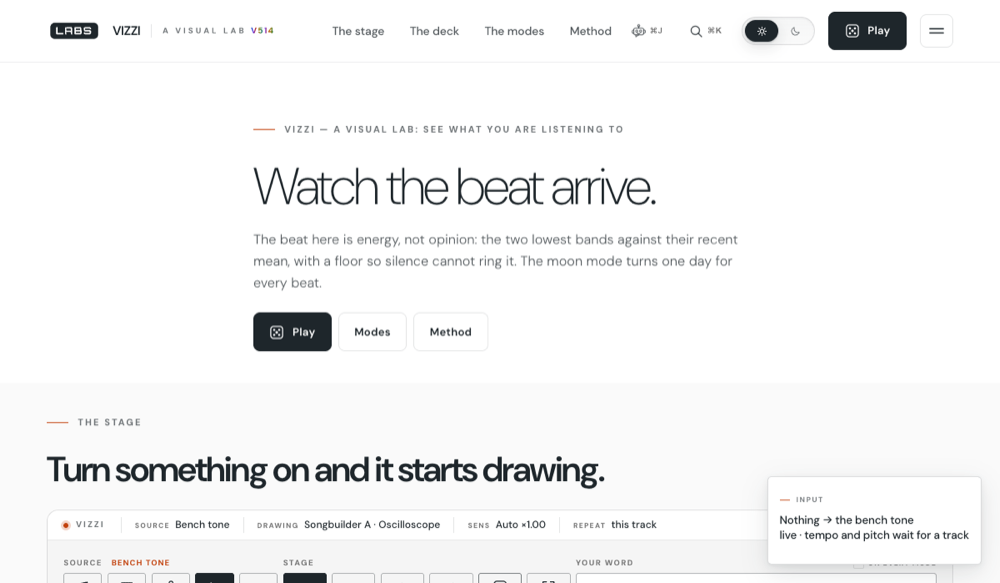
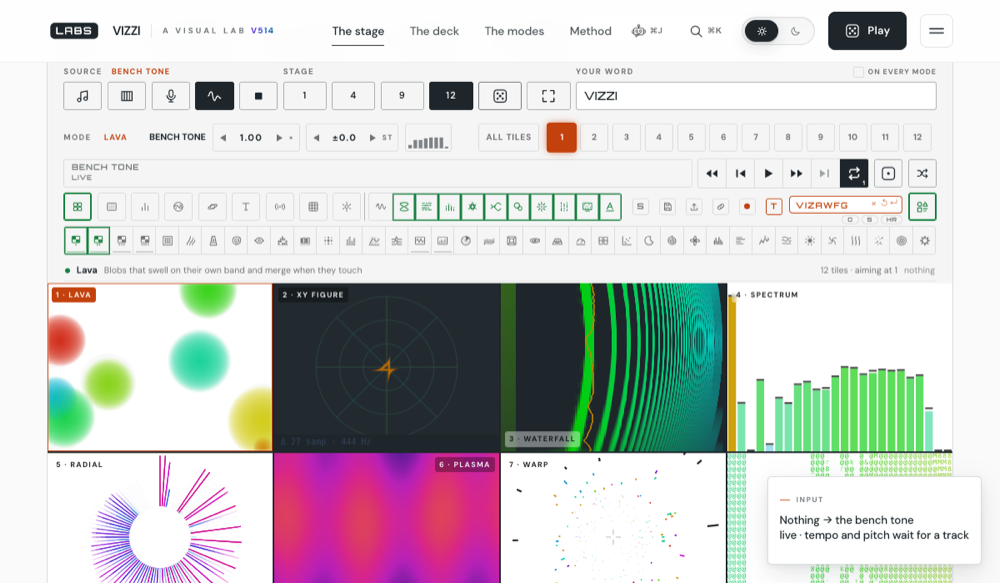
Most visualisers are a screensaver with a microphone taped to them: the shapes move, but nothing in the picture answers a question you could have asked about the sound. VIZZI answers questions. Watch the XY figure go from a fat diagonal to a circle and you have just seen the stereo field open up. Watch a bright horizontal streak arrive in the waterfall and you have just seen a resonance you would have spent an hour hunting in a plugin.
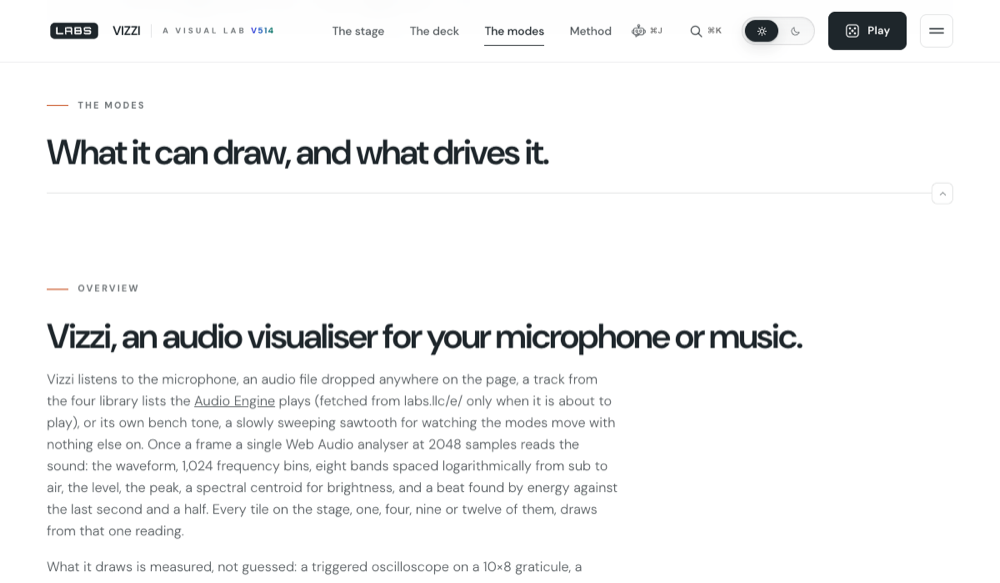
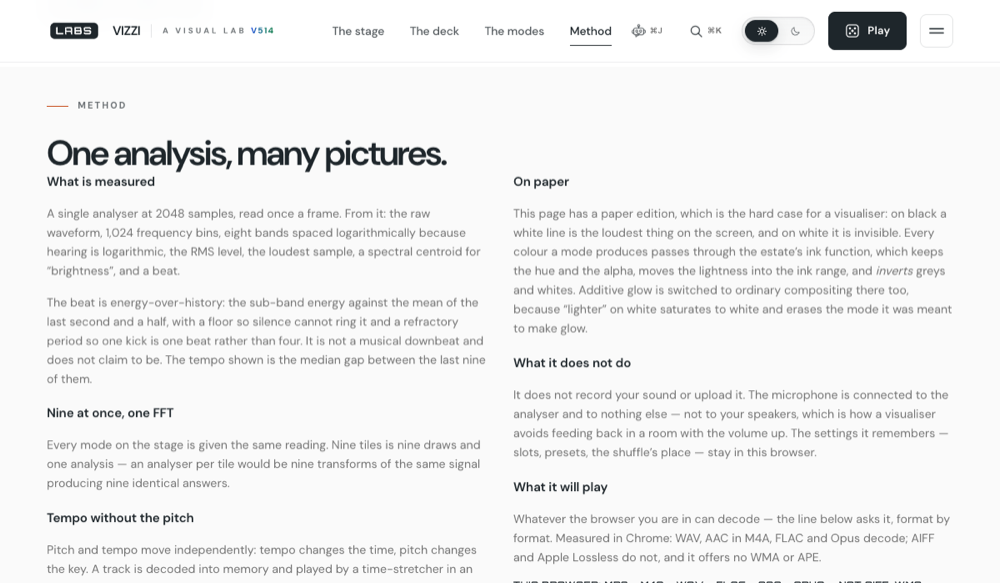
The reason it can is the boring part underneath, and the boring part is the best thing here. Every tile is handed the same reading of the sound, once a frame. Not twelve analysers. One. The page tells you why, unprompted: nine analysers on one signal would be nine transforms producing nine identical answers.
“What it draws is measured, not guessed.”VIZZI, on its own overview
Take that as a dare; it holds up. The oscilloscope is triggered and sits on a 10×8 graticule like an instrument. The VU needle is held to real ANSI C16.5 ballistics rather than jumping about because that looks lively. The cellular automaton is not decoration either: the eight bands set the Wolfram rule, so the pattern you are looking at is literally the shape of the spectrum, drawn as a law. And the moon is the actual near side as Lunar Reconnaissance Orbiter mapped it, turning one day for every beat you give it — the most delightful thing in the estate.
Then the deck, where the yes turns into a grin. The analyser sits at the end of the signal chain, so every knob changes the picture as well as the sound. Push the low shelf and the bass-following modes physically grow. Close the filter and the treble ones go quiet. Slow the tempo to 0.10× without moving the pitch and watch a snare decay frame by frame. You are not adjusting a visualiser. You are playing one.
Bring headphones and something you love. Nothing you drop on the page is uploaded, and the microphone reaches the analyser with its monitor closed, so it never comes back out of your speakers.
It is heavy, and it is dead until you feed it. A cold load of the stage pulled 689 KB across 49 requests before a single tile had anything to draw, and what you get for that on arrival is a grid of empty boxes and an instruction. The page's own answer is the bench tone button — a good answer, but one more thing to find, and a visitor has paid for twelve renderers they cannot yet use. The other honest ding: the mode count. The page ships 49 drawing modes and we counted every one of them in the live markup, but the number appears nowhere in the visible copy — only in the meta description. A shelf that deep should say so on the shelf.
None of that moves the grade. It is an A because it tells you what it is doing while it does it. Yes, and — bring good headphones.
Measured by this desk against https://labs.llc/vizzi/ in a headless browser with analytics blocked at the network layer, 2026-09-22 at 22:39:45Z, 22:40:17Z and 22:41:36Z. The mode and effect counts are the distinct data-mode and data-fx values in the rendered page, with the transport and deck keys excluded by hand.